

Photo by Lukas Blazek on Unsplash
Creating a Product Sales Insight Using Excel and Power Bi
Data Analytics Team 4 - Side Hustle Portfolio Boot camp (Week 1)


Introduction
This team blog was created to document our journey through the side hustle portfolio boot camp 6.0 and our thought process for each task given. It's been an awesome journey from the 4weeks with Side Hustle internship training to finally being in the boot camp (portfolio boot camp) which will also run for another 4 weeks. This is a great platform to kick start our journey into data analysis by gaining work experience and building our portfolio.
This first week started off with getting to know each other and discover their strengths and weakness, thus choosing a team lead and assistant. The task given is to "choose a product, create on a sales insight analysis. Scrap the data, clean data and visualize with Excel and Power Bi." The rest of this blog post shows you the steps taken to complete this task.
Scrapping the Data
The data used for this insight analysis was extracted from Kaggle and It is an E-commerce sales data. Here is the link to the data set - kaggle.com/datasets/akavinashk07/sales-data... In the bid to achieve our desired result, we divided ourselves into two groups: a Power bi team and an excel team. Each team proceeded to analyze the data with their respective tools. We'll discuss similarities or differences at the end of the task.
Analysis with Excel
Before performing analysis on any data, it is advised to clean the data.
- Delete parameters or column headers that are not necessary.
- Fill in blank spaces if any
- Change the data type of each column headers to the right one.
Pivot tables
In order to carry out visualizations, we need to first of all create pivot tables. Pivot table is a data summarization tool in Excel used to summarize, sort, group, etc, data. It makes your tables less bulky. It somewhat has similar function to data modeling.
To create you pivot table, Click anywhere around your data array, click insert, then pivot tables. It allows you choose the array, whether you want an existing or new worksheet. Then OK. We decided to use a new worksheet. Your column Headers would appear at the RHS as Pivot Table FIelds list. Then to build your report, Choose Parameters from the fields list and drag below into the field (filters, columns, rows, values). Only numeric parameters should be dragged into the values field. Pivot Tables were created for:
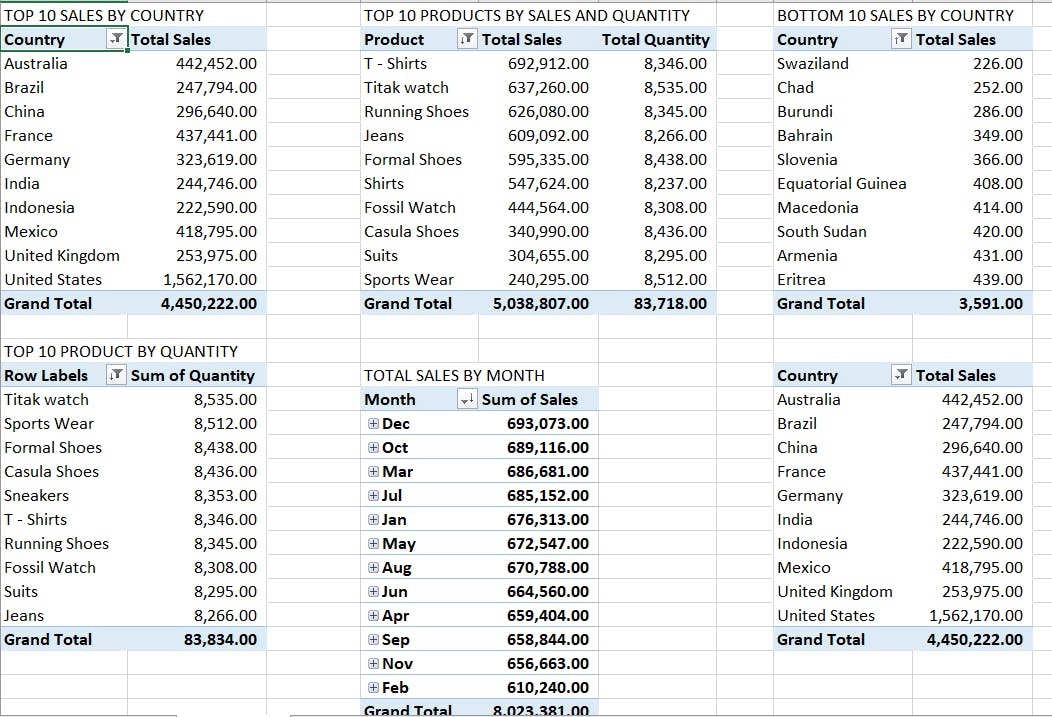
- Top 10 sales by country
- Top 10 products by product and quantity
- Total Sales by month
- Top 10 product by quantity
- Bottom 10 sales by quantity
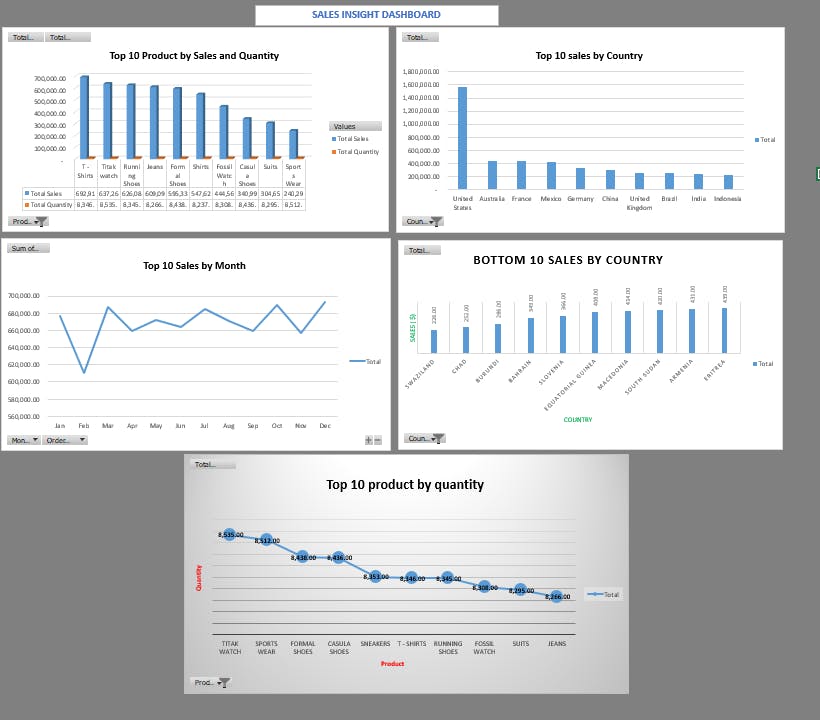
For each pivot table, we inserted befitting pivot charts such as - line chart, bar chart, pie charts, etc We then combined these charts together to form a dashboard. The dashboard would be shown in the visualization segment of this post.
Visualization with Excel
Power Bi Analysis
Being a very large data, we decided to model the data, but prior to modeling we made sure we cleaned the data.
Data modeling is the organizing of data into tables based on groupings and relationships to reduce redundancy and optimize efficiency.
In lay man's term, it is basically reducing the size of your very large table by grouping into smaller tables based on relationships.
The table is grouped into two types:
- Facts Table: contains the main business events e.g profit, quantity, discount, etc.
- Dimensions Table: contains variables that describe the business e.g location, customer name, etc.
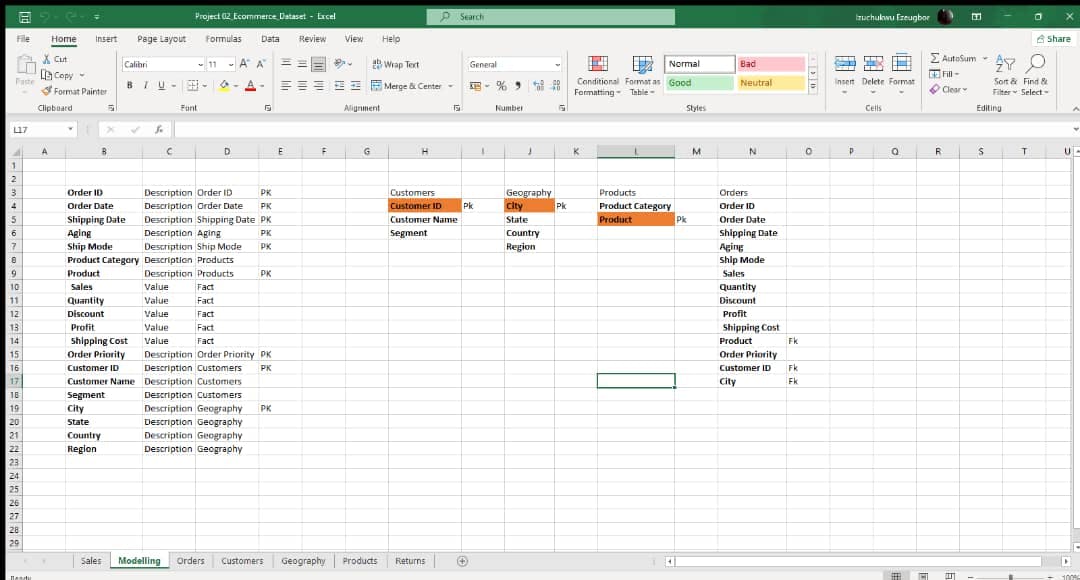
Steps taken in creating these tables include-
- List all the reporting fields (column headers) in a new sheet
- Identify the main business events and the descriptive parts of the business.
- Group all the field categories to form hierarchy on which the dimension table would be built.
- Identify the Primary keys (a variable in a group that has the lowest granularity).
- Identify your Facts Table and Dimensions Table
Power Query
- After modeling, you load the large data in Power Query(a tool in Power Bi).
- Some transformation activities we performed was to ensure the blank space were filled, we ensured all the column headers had the right data types.
- This table is duplicated into two or three more tables depending on how many dimension tables you have.
- Each table duplicated should be renamed with the appropriate title
- Go through all your individual tables to make sure all unwanted columns are removed.
- Remove all the duplicates in the dimension tables. This step isn't done for the facts table because this is the table that keeps recording whatever takes place in the business and it serves as a connector towards the other dimension tables.
- Then close and apply.
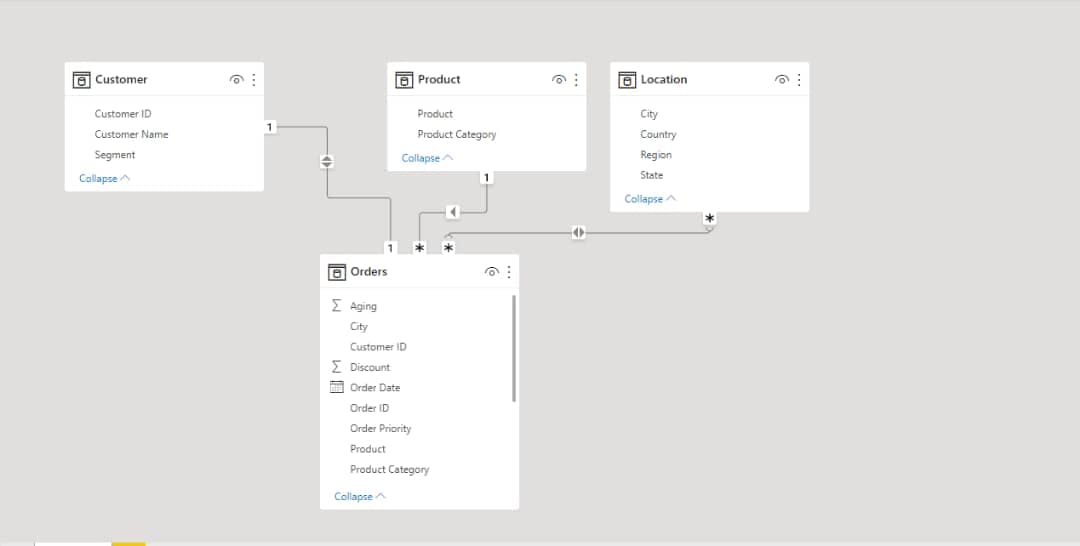
Load to Power Bi When the data is loaded, You can click the model icon at the left hand side to see the dimension tables and the fact table are well connected. Any dimension table that is not connected means that it has no unique values (there are still duplicates present).
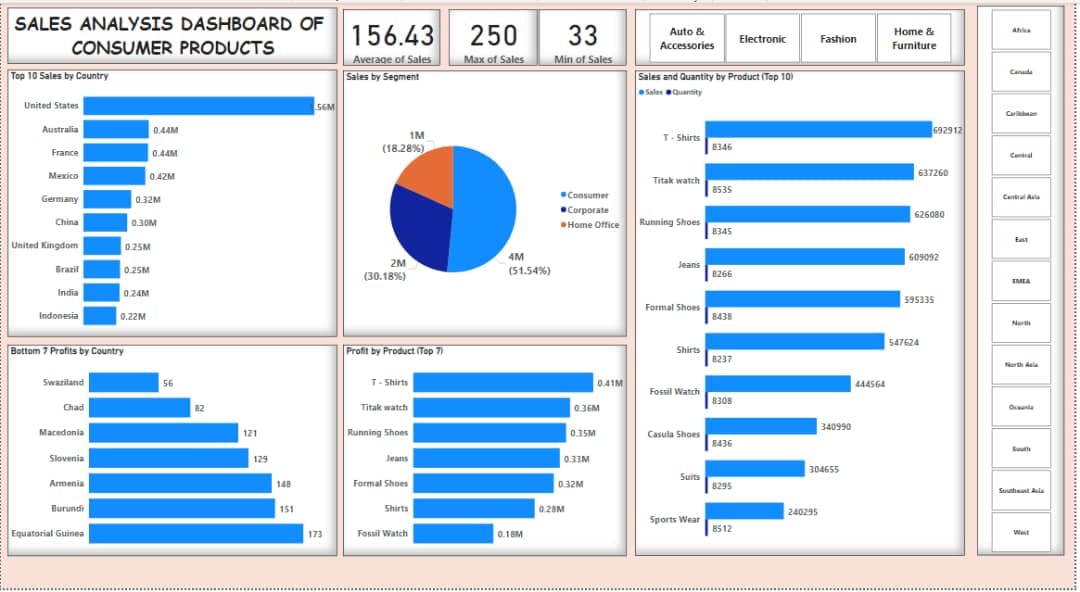
Visualization with Power Bi
Visualization tells a story, removing the noise from data and highlighting useful information. Data is much more appreciated when it is visualized. For the power bi visualization was created for:
- Top 10 countries by sales
- Top 10 countries by sales an quantity
- Sales by customer Segment
- Top 7 product by profit
- Bottom countries by profit
Conclusion
During our meetings we decide to each team would create 2 common visuals which are- Top 10 countries by sales and Top 10 countries by sales an quantity; and 3 different visuals which have been previously listed. We chose the two common ones in order to show that visualization can be done with both excel and power bi efficiently.
The first visual showing top 10 countries by sales shows that the country with the highest sales is the United States with approximately $1.6 million followed by Austrailia with approximately $400,000 , while the country with the lowest sales is indonesia with $200,000. The second visual titled Top 10 Products by sales and quantity shows that Tshirts had the highest sales of $692,912 with 8,346 pieces sold with the least being Sports wear with only a total sales of $240,295 and 8,512 pieces. This shows that even though there is high demand for the two products, higher value is placed on the Tshirts.